WiFi Heat Map: What It Shows and When You Need One
A WiFi heat map is a floor plan coloured to show how strong the wireless signal is at each point. It is a useful way to see coverage at a glance and to explain why one corner of a building never works. It also gets oversold, so it helps to know what a heat map can and cannot tell you.
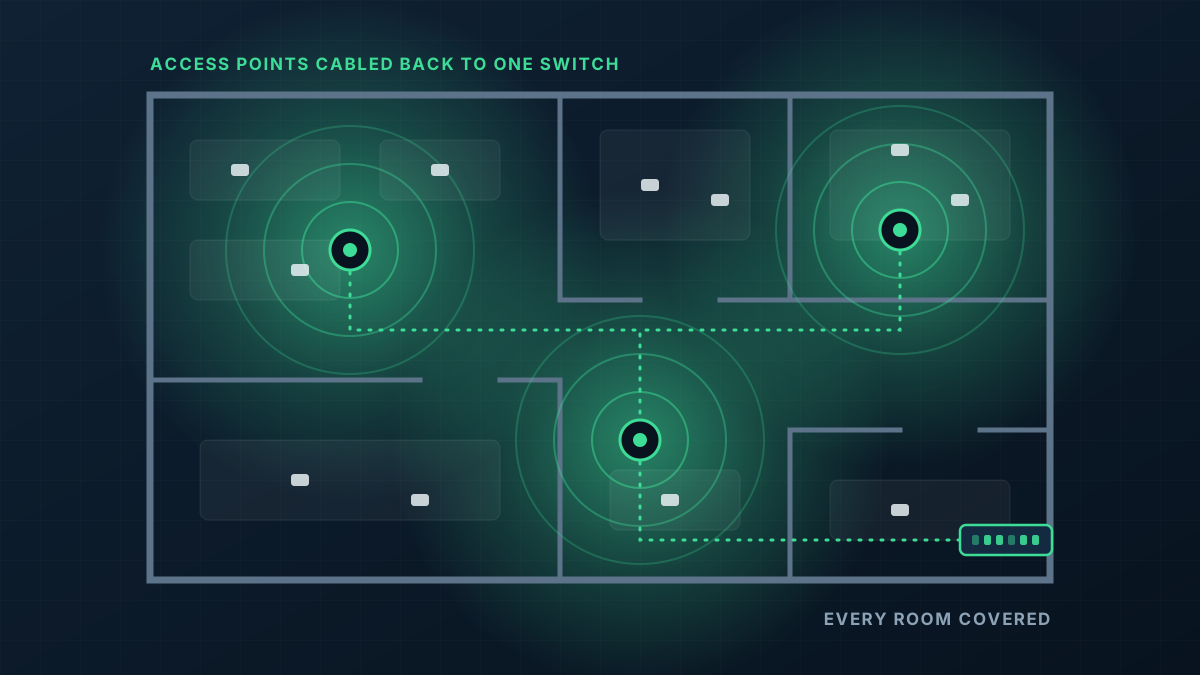
What a heat map shows
The map lays signal strength over the floor plan, usually running from warm colours near an access point to cool colours where the signal is weak. Dead spots show up as gaps. Heavy walls show up as sharp edges where the colour changes suddenly.
That makes it a good communication tool. A plan showing the signal stopping at a concrete wall explains in one picture why the back office has been complaining for a year.
Predictive and measured maps
There are two ways to produce one, and they answer different questions.
- Predictive: software models the signal from a floor plan, the wall materials you tell it about and the proposed access point positions. It is done before anything is installed and is used to plan a new network. Its accuracy depends entirely on how well the walls have been described.
- Measured: someone walks the building with a device that records the real signal at each point. It shows what is actually happening, including problems a model would never guess, and it is used to check an installation or diagnose an existing one.
What a heat map does not tell you
Signal strength is only one part of WiFi performance. A map can be bright from wall to wall while the network is still slow, because it says nothing about how many devices are sharing each access point, how much interference there is from neighbouring networks, or whether devices are roaming properly.
This is the most common misunderstanding. Strong signal means a device can hear the access point clearly. It does not mean the access point has capacity to spare. In busy offices, capacity is usually the real problem.
When one is worth doing
For a house or a small office, an experienced installer can place access points from the floor plan and the wall types, then confirm the result by testing in each room afterwards. A formal survey adds little.
The case for a heat map grows with the size and complexity of the site: multi-level offices, warehouses with racking, hospitals, schools, large venues, and anywhere a gap in coverage would be costly. It is also useful when an existing network has problems nobody can explain.
Doing a rough one yourself
You can get a fair picture without special tools. Walk the building with a phone, note the signal indicator and run a speed test in each room, and mark the results on a printed plan. It will not be precise, though it will show you where the trouble is, and it is exactly the kind of information that helps us quote. Our guide to how many access points you need explains what we do with it.